Click to expand
What is this image?
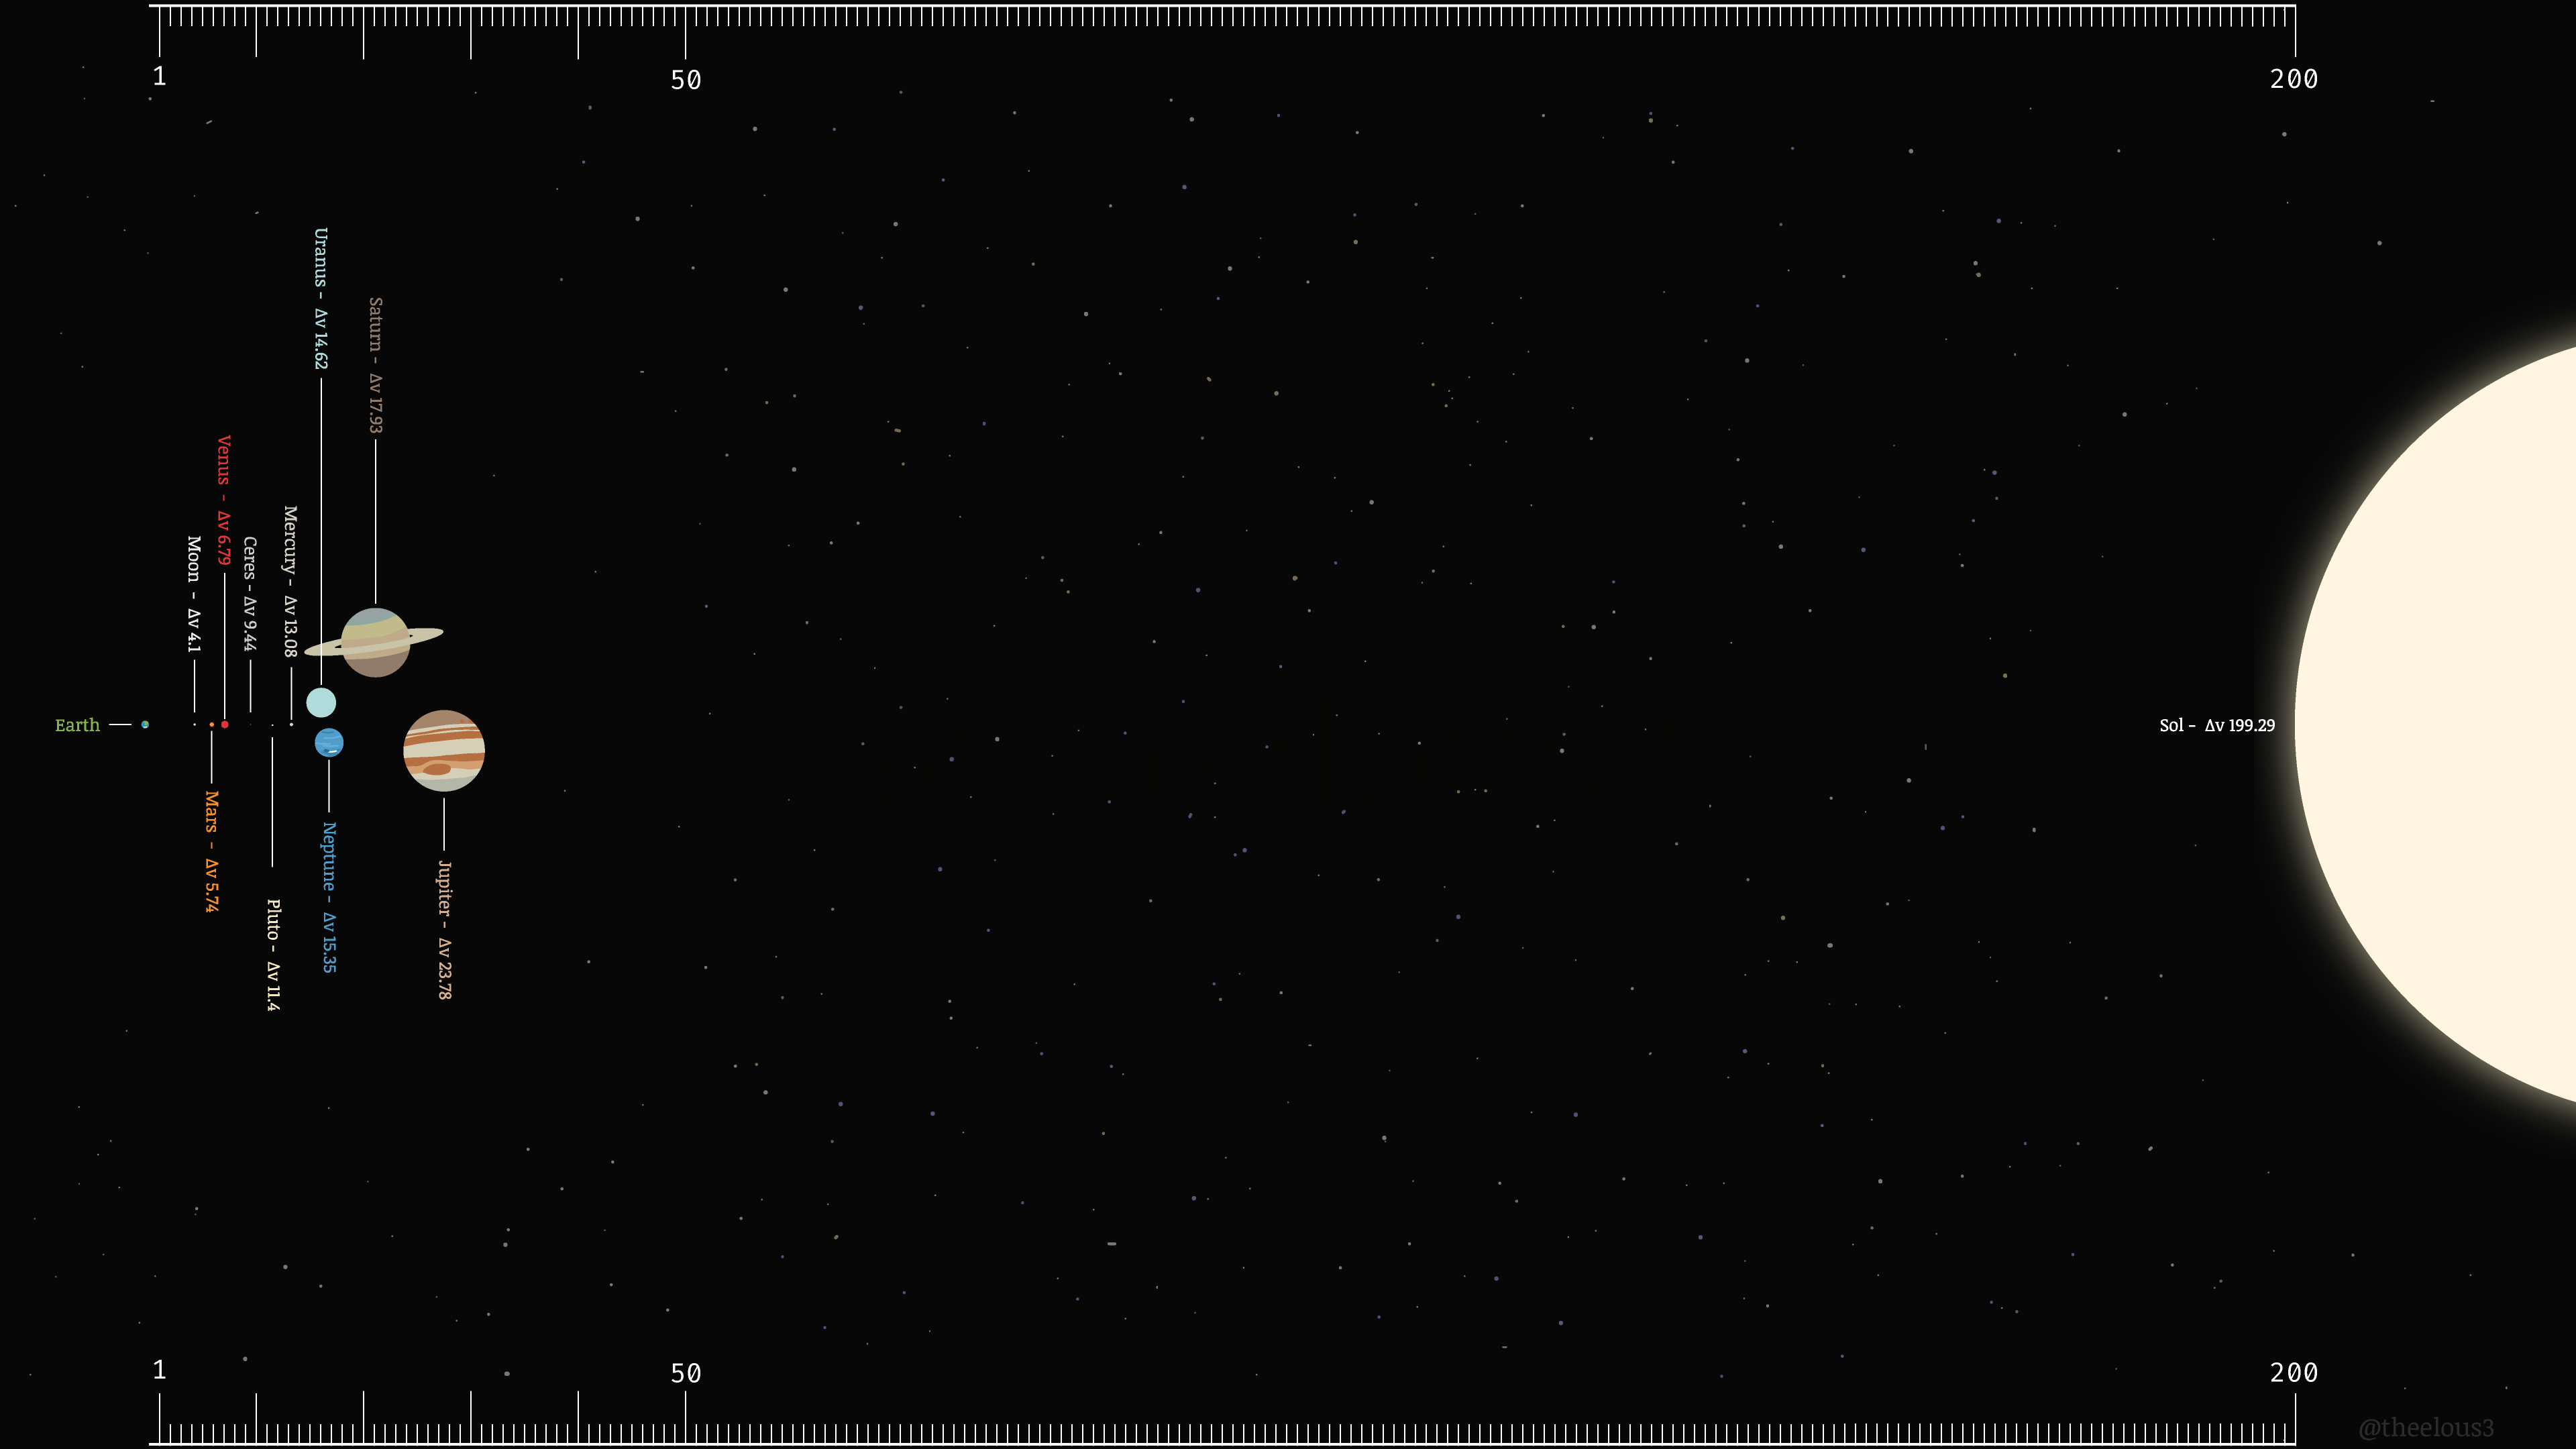
It is an accurate and to scale map of the solar system in both size and delta-v! It’s the delta-v from low earth’s orbit to the low orbit of the given celestial body.
Why?
I always wanted a solar system map which was fully to scale. Of course, using normal distances this is essentially impossible, and if you try to make it possible, the scale of the objects is too small to see.
As I learned about delta-v from wiking around one day I realised it was representative of travel, which on earth is an important aspect of distance that we relate to, and it used units that were much more human scale than the hundreds of millions to billions of kilometers or AU we normally measure these distances in.
What is delta-v? It is, in km/s:
a measure of the impulse per unit of spacecraft mass that is needed to perform a maneuver such as launching from or landing on a planet or moon, or an in-space orbital maneuver
This means that to go to the moon, you need to impulse your way out of earth’s gravity well by accelerating away from earth. In space there is no “braking”, there is just acceleration in the opposite direction to travel. So as you near your destination you need to accelerate to slow yourself down from your travel (which gets harder as you get deeper in to the gravity well of the destination object) just enough to match the velocity of the orbit you want to occupy.
This has strange consequences. The overall “work” to get to smaller objects is typically much lower because of their lower destination mass. This means Pluto (5.9 billion km away) is “easier” to get to than something like Jupiter (778.5 million km away).
See?
Click to expand
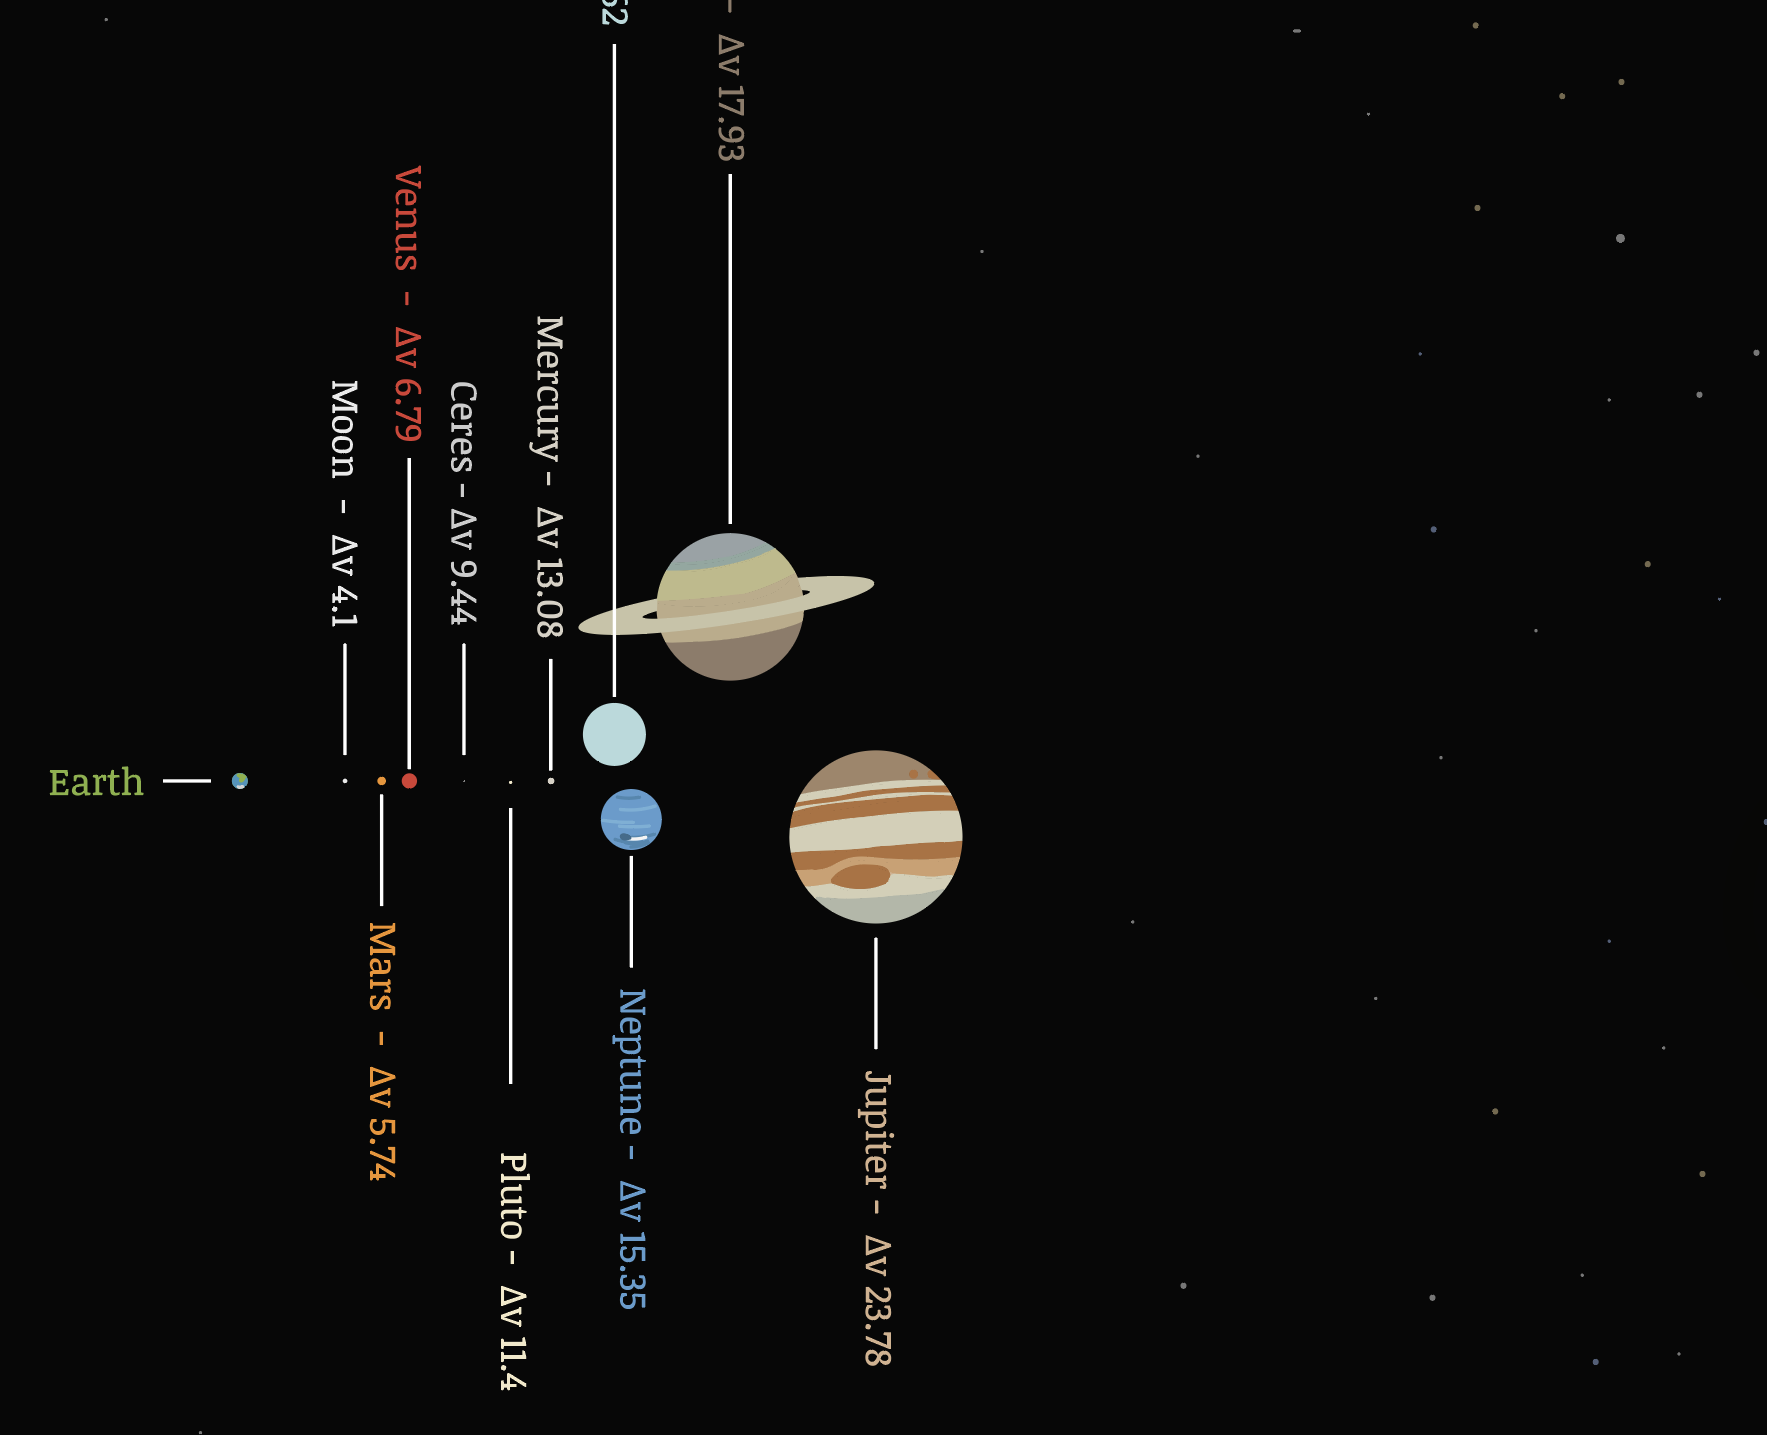
The highest delta-v object is the sun at about 200 and the lowest (commonly known planetoid) is the moon at about 4.
This makes Mercury harder to get to than much bigger objects like Venus, because of Mercury’s proximity to the very massive sun.
Included are an object each from the main asteroid belt (Ceres), and the Kuiper belt (Pluto). They are vast distances apart, but much like Uranus and Neptune, proximity in size gives close proximity in delta-v!
I found this reordering of the map absolutely fascinating to be honest.
Notes:
I did all of the work for this some time ago.
The charts below and this image don’t take in to account the manymanymany ways in which the d(v) changes based on acceleration and aerobraking using fancy inter-planet travel tactics. Depending on the year, mission profile, payload, and destination, these d(v) values can vary wildly.
I based it off (lovely!) work by /u/CuriousMetaphor : https://old.reddit.com/r/space/comments/1sjxdy/deltav_map_of_the_solar_system_updated/
as well as Nasa’s trajectory browser https://trajbrowser.arc.nasa.gov/traj_browser.php
wiki https://en.wikipedia.org/wiki/Delta-v_budget#Delta-vs_between_Earth.2C_Moon_and_Mars
and a handfull of other sources that are lost to time. I found some tooling that was amazing which let me confirm the reddit graphs very closely but… whoosh. The wind has it now.